The DC Plan will provide reduced Delta export salinity benefits for any Delta outflow. But the Delta export salinity is increased when the Delta outflow is reduced to less than 10,000 cfs. Understanding how daily Delta outflows control the salinity patterns in Delta channels is important for Delta water management and for estuarine habitat management. The DC Plan could allow more flexible estuarine habitat management because the water supply salinity will be less dependent on Delta outflows.
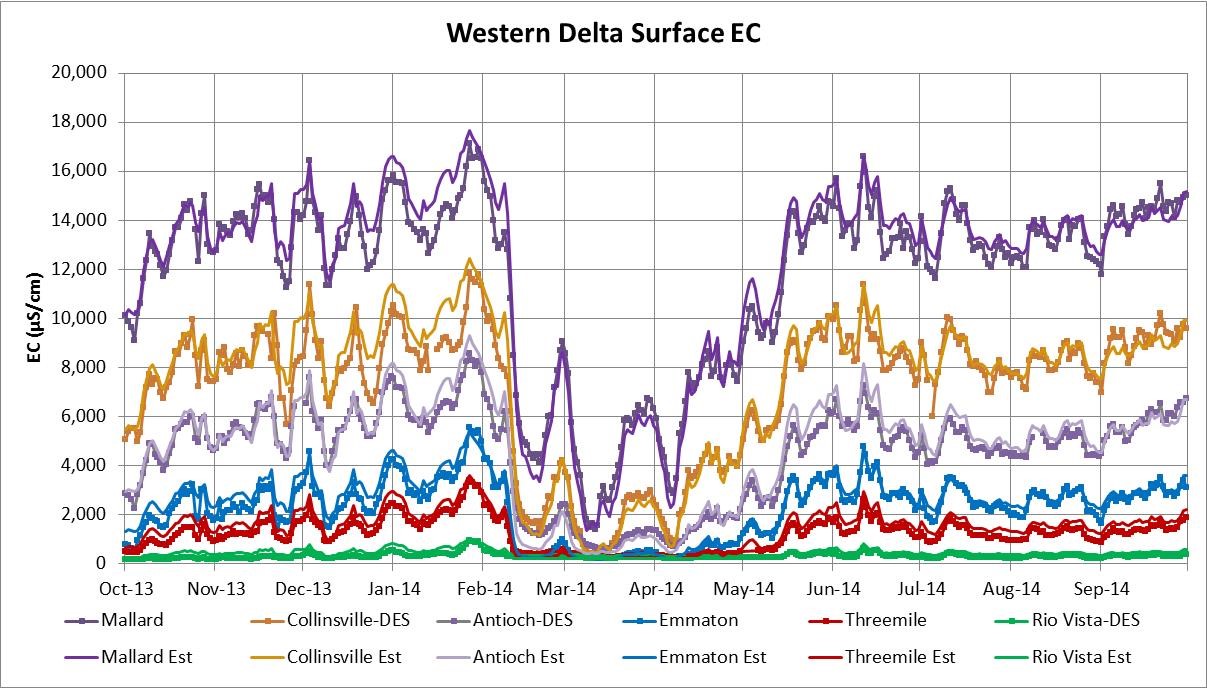
The salinity gradient in the western Delta and in Suisun Bay is controlled by the Delta outflow (cfs) and is measured as electrical conductivity (EC, µS/cm). The estuarine salinity gradient is about 750 µS/cm per km and shifts downstream with higher flows and moves upstream and downstream about 5-10 km between low tide and high tide; the position of the salt wedge is described with daily average EC measurements. The salinity gradient can be approximated with a linear or a logistic curve for a range of outflows.
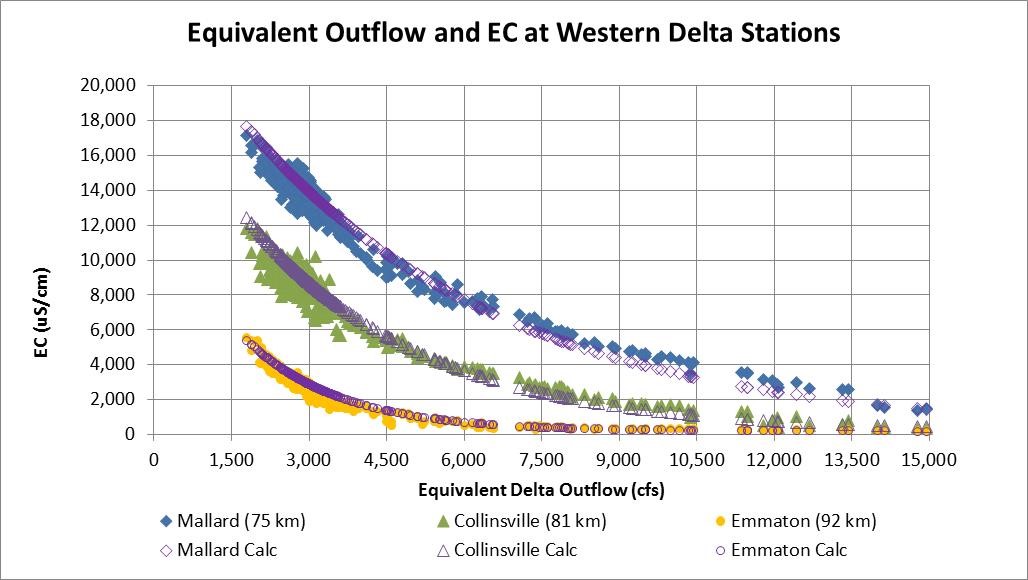
The daily Delta outflow is estimated from a daily water budget, with the Delta channel depletions for evaporation and crop transpiration approximated with a seasonal pattern. However, the salt gradient response to a change in the Delta outflow is delayed by several days. The “G-model” formulation was introduced by Contra Costa Water District staff to calculate the effective Delta outflow that controls the salinity gradient. The effective Delta outflow is a “volumetric” average (e.g., similar to a moving average) of the daily Delta outflow estimates. The effective outflow will respond more slowly when the outflow is low and will respond more quickly when the outflow is high. The “G-model” formulation also estimates the EC at a specified location (i.e., CCWD intake) as a negative exponential function of the effective daily Delta outflow (cfs):
Daily EC (µS/cm) = min EC + max EC x exp [- coefficient x effective outflow (cfs)]
The D-1641 X2 objective is the daily average position of the 2 psu bottom salinity (3,830 uS/cm), specified as the distance (km) upstream of the Golden Gate. The daily X2 depends on the previous X2 and the current daily outflow estimate as:
Daily X2 (km) = 10.16 + 0.945 x previous X2 (km) – 1.487 x Log [outflow (cfs)]
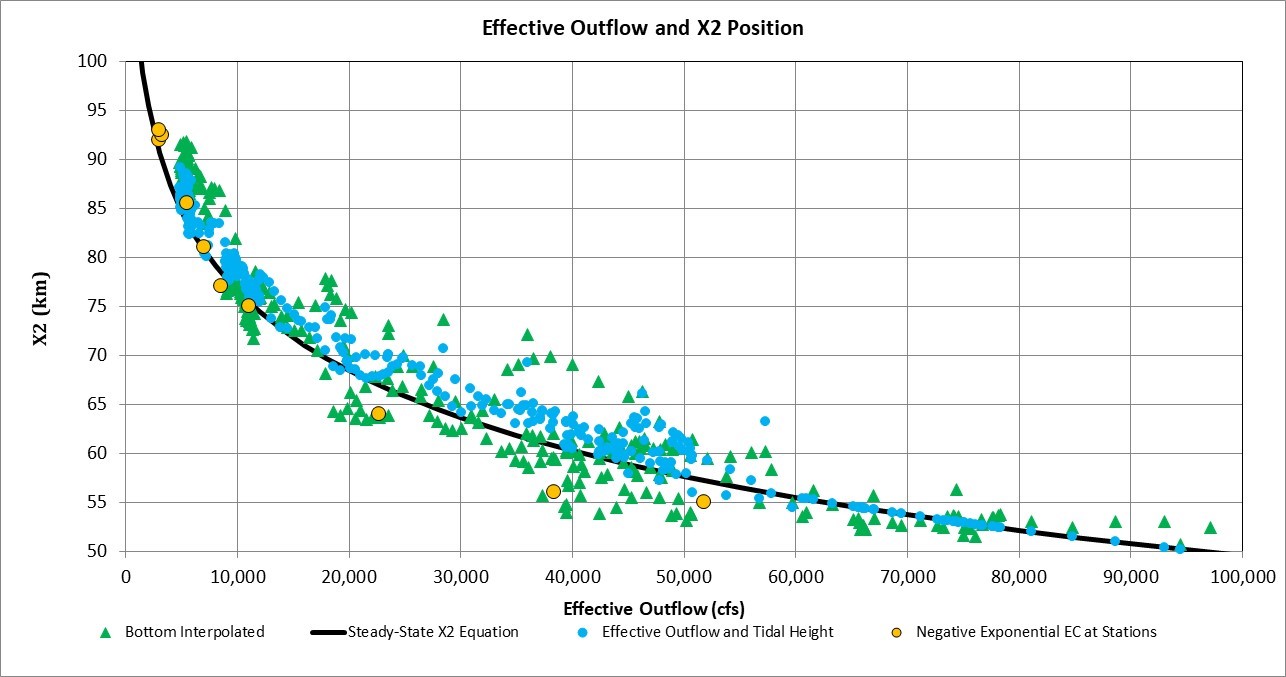
This equation can be rearranged to give the X2 for a steady (i.e., effective) outflow:
X2 (km) = 185 – 27 x Log [Effective Outflow (cfs)]
The effective outflow required to maintain X2 is therefore:
Effective Outflow (cfs) = 10 ^ [185 – X2 (km) / 27]
An outflow of 1,000 cfs corresponds to an X2 of 104 km, which is upstream of Rio Vista. An outflow of 10,000 cfs would correspond to an X2 of 77 km, about 2 km upstream of Chipps Island. An outflow of 100,000 would correspond to an X2 of 50 km, about 5 km downstream of Martinez.
Because the relationship between outflow and X2 is logarithmic, the X2 position will change by a constant amount for each flow increase factor. Moving X2 downstream 1 km would require the outflow to increase by about 9%, and moving X2 downstream 5 km would require the outflow to increase by about 55%. The D‐1641 objectives require 7,100 cfs for X2 at Collinsville (81 km), 11,400 cfs for X2 at Chipps Island (75 km) and 29,200 cfs for X2 at Port Chicago (64 km). Many biological evaluations of aquatic habitat and fish abundance have suggested a negative relationship with X2, which is equivalent to a positive relationship with outflow. The DC Plan might shift some of the historical relationships between X2 and habitat or fish abundance because fish in the lower San Joaquin River and Old River habitat would no longer have any losses from export entrainment.
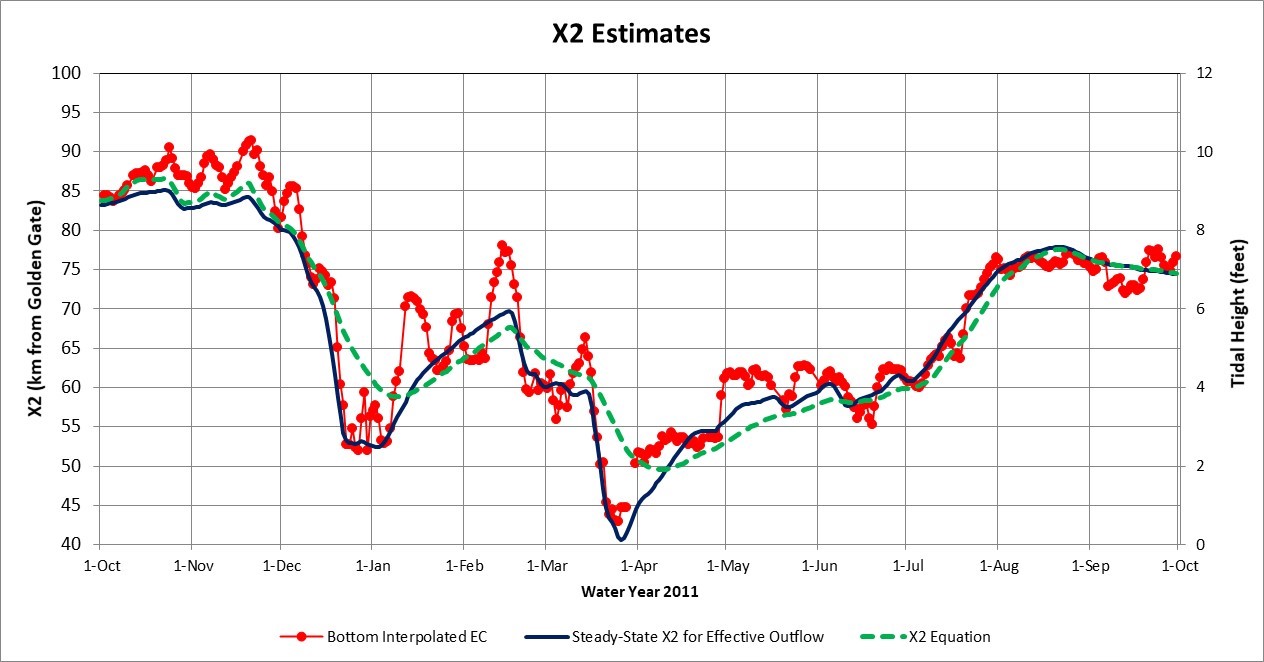
Here is a presentation made to the Delta Science workshop on Delta outflows in 2014. The slides show seasonal patterns of estimated outflows, measured EC and interpolated X2 for WY 2011 which was a high flow year with Delta outflows ranging from 3,000 cfs to 250,000 cfs.
Here is a report presented to the Delta Modeling (DSM2) Users Group in 2015. This report describes methods that could be used to estimate the daily effective outflow from the daily measured X2. The daily EC patterns at each of the stations were accurately estimated with the daily effective outflows for WY 2014. The measured X2 values were higher than the calculated X2 values, suggesting that the actual Delta outflows in WY 2014 were lower than the outflows estimated from the daily water budget and assumed channel depletions.
Here is the executive summary from a DWR report on south Delta salinity patterns in 2009-2013. This report provides a detailed description of the effects of San Joaquin River flows and agricultural drainage and wastewater discharges on measured EC in the south Delta channels and at the CVP and SWP exports. The DC Plan would separate the SJR flow and salt from the export pumps and would reduce the seawater intrusion at the CVP and SWP exports during periods of low Delta outflow.
Here is the full report on south Delta salinity patterns with attachments.